Sunderland Greyhound Trap Stats — Win Percentages, Bias Data & Distance Splits
Best Horse Racing Betting Sites – Bet on Horse Racing in 2026
Before you study form, before you weigh up a trainer’s record, before you even glance at the going report, there is one variable staring at you from the racecard that requires zero historical knowledge to assess: trap position. Sunderland greyhound trap stats tell a story that most casual bettors never bother to read — and that story shifts depending on whether you are watching a 261-metre dash or a gruelling 828-metre stayer event.
Every greyhound track in the UK has its own geometric fingerprint. The circumference of the oval, the distance from the boxes to the first bend, the type and position of the hare — all of these factors interact with the six starting traps to create measurable, repeatable biases. At Sunderland, a 379-metre circumference and an Outside McGee hare system produce a trap profile that is distinct from, say, Towcester or Romford. Understanding that profile is not a guarantee of profit, but ignoring it is a guaranteed blind spot.
This article breaks down the mechanics of trap bias at a general level, then narrows the lens to Sunderland specifically, examining how the stadium’s four race distances alter the value of each trap. We finish by placing Sunderland in context against other GBGB-licensed venues, so you can see where the track sits in the national spectrum. If you have ever wondered why Trap 1 winners at Sunderland seem to come in clusters, or why wide runners on the 261-metre sprint face an uphill battle, the data is about to make things clearer.
How Trap Bias Works in Greyhound Racing
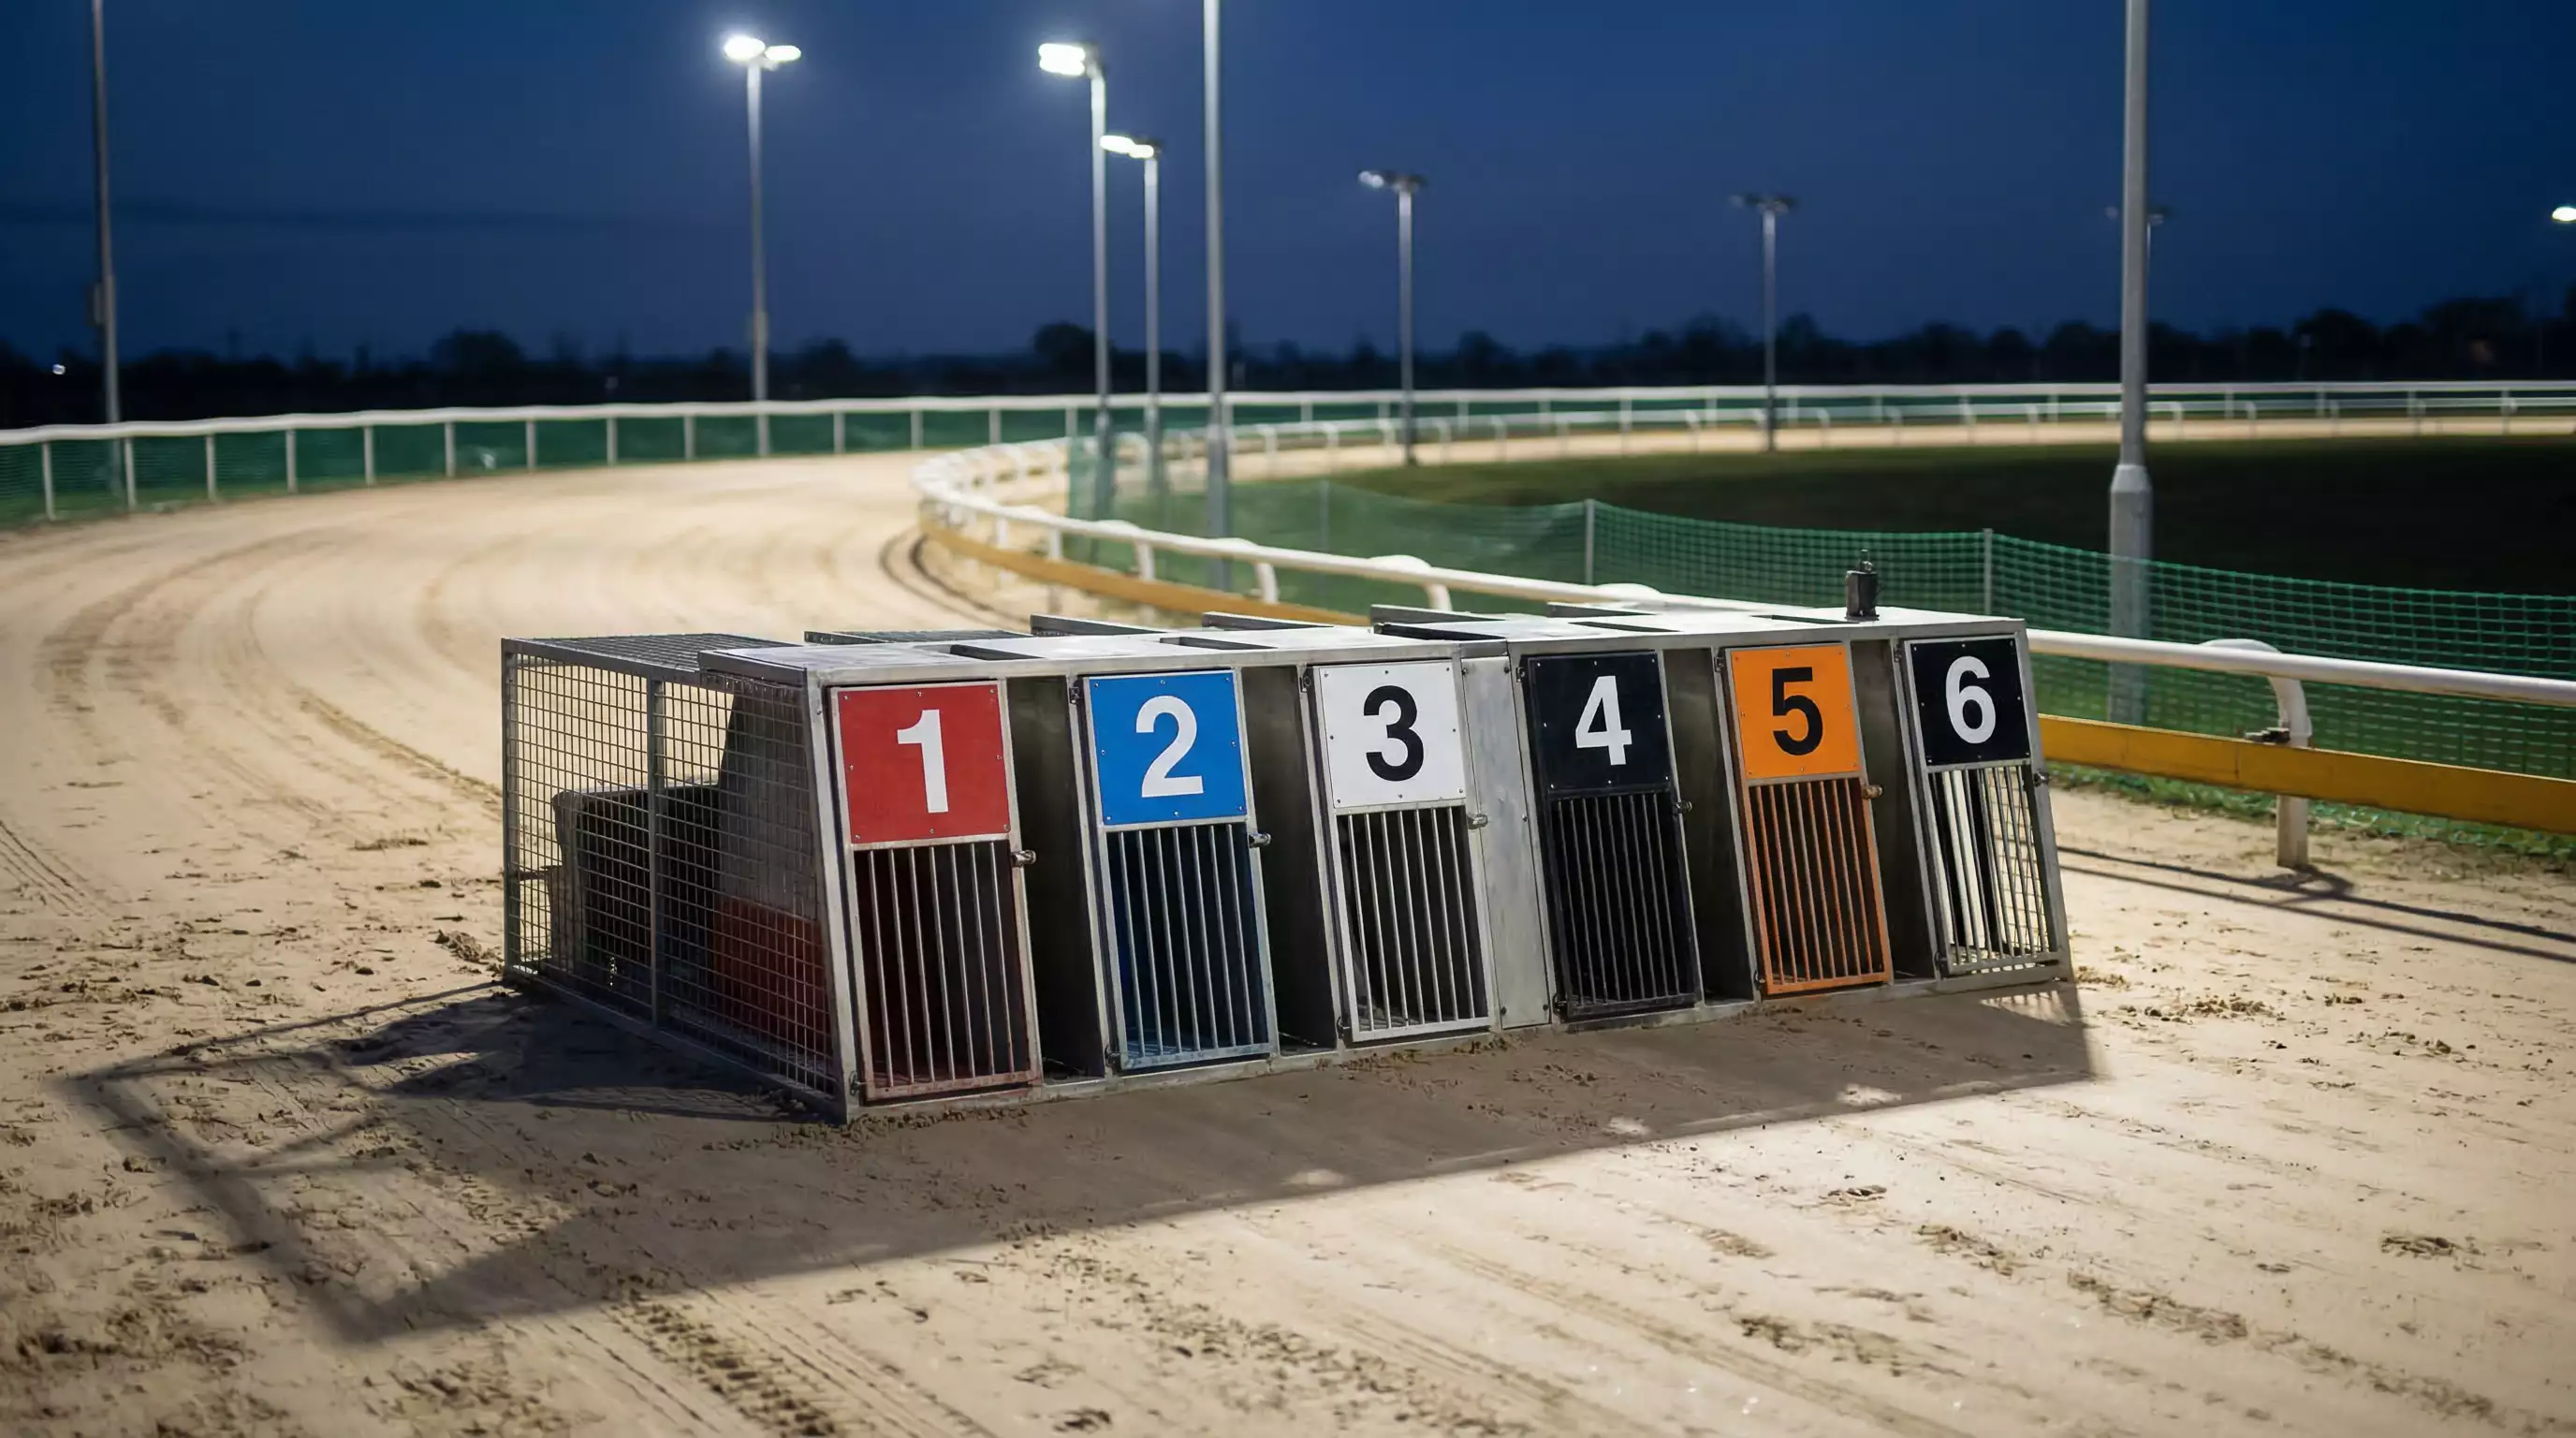
Six traps, six dogs, one hare, two bends before the home straight. In a perfectly symmetrical universe each trap would produce a winner exactly 16.6% of the time. The universe, however, is not symmetrical — and neither is a greyhound track. Across all GBGB venues in the UK, data compiled by The Game Hunter shows Trap 1 winning between 18% and 19% of races, roughly two percentage points above that theoretical baseline. Trap 6, depending on the track, can sit anywhere from 14% to 21%. The spread is not random. It is structural.
The primary driver is the inside rail. A greyhound breaking from Trap 1 has one flank completely protected: the rail sits to its left, meaning interference can only come from the right. Traps 2 through 5 are exposed on both sides, while Trap 6 sits on the open outside, where the dog must either lead into the first bend or risk being pushed wide by anything that drifts off its racing line. In a sport where fractions of a second separate first from fourth, these geometry problems are not trivial.
Then there is the run-up — the straight distance between the starting boxes and the first bend. A long run-up gives every trap time to settle into a racing line before the first turn compresses the field. A short run-up amplifies the advantage of the inside draws, because the field is still bunched when the bend arrives and inside dogs carry natural rail protection into the turn. Sunderland’s run-up distances — 93 metres on the 450-metre trip and 84 metres on the 640 — are moderately long by UK standards, which slightly tempers the inside bias relative to tighter venues.
Hare type matters too. UK tracks use either an inside or outside hare rail. An outside hare — which is what Sunderland runs, specifically the Outside McGee system — means the lure travels along the outer rail. Dogs drawn wide can sometimes hold a straighter early line towards the hare, while inside dogs must angle across the pack. This does not automatically flip the inside bias, but it softens it, and at certain distances and with certain field compositions, a dog from Trap 5 or 6 can find a cleaner early path than it would on an inside-hare track.
One subtlety that casual punters overlook is that trap bias is a population effect, not a prediction. Saying Trap 1 wins 18% of races does not mean any individual dog in Trap 1 has an 18% chance — its form, speed, and running style still dominate the calculation. What the data tells you is that over a large sample of races, the track’s geometry tilts the odds slightly in favour of certain positions. For a serious bettor, “slightly” is often the gap between a losing and a profitable book.
Finally, grading plays a hidden role. Track handicappers assign traps partly based on a greyhound’s running style. A known railer will often be drawn in Trap 1 or 2; a wide runner may end up in 5 or 6. This means some of the measured bias is not geometry alone — it is a feedback loop where the grader puts a dog in the trap where it is most likely to run cleanly, inflating that trap’s win count. Disentangling grading effects from pure track bias is difficult, but awareness of the loop keeps your analysis honest.
Sunderland Trap Data — What the Numbers Show
Now that we have the theory, let us look at what actually happens when the lids fly open at Sunderland. The stadium runs five fixtures a week — Friday evening, Sunday afternoon, plus BAGS meetings on Monday, Wednesday and sometimes Thursday — so the sample sizes here are robust. Across all distances and grades combined, the trap stats at Sunderland follow the broad national pattern with a few local wrinkles worth unpacking.
Trap 1 at Sunderland delivers a win rate in the high-18% range over the course of a typical racing year. That is consistent with the UK-wide figure and slightly below what you would see at a pronounced inside-bias track like Towcester. The Outside McGee hare is the single biggest reason: because the lure runs along the outer rail, the inside draw does not carry the same magnetic pull towards the hare that it would on an inside-hare circuit. Dogs in Trap 1 still benefit from rail protection, but the hare angle creates a mild tension between running the rail and tracking the lure.
Trap 2 tends to be the steadiest performer over 12-month rolling samples. It benefits from near-inside positioning without being directly against the rail, meaning the dog has some room to adjust its line into the first bend. At Sunderland, Trap 2 typically sits around 17–18%, making it a solid but unspectacular draw across most race types.
Traps 3 and 4 — the middle draws — are where the picture flattens. These are the traps where early crowding is at its worst: pressure comes from both flanks, and the run to the first bend often degenerates into a dogfight (in both senses) for position. At Sunderland’s 93-metre run-up on the 450, the middle traps have enough straight to sort themselves out before the turn, but on the shorter 84-metre approach for the 640, the squeeze arrives faster. Win rates for Traps 3 and 4 typically hover around 15–16%, slightly below the theoretical baseline.
Trap 5 is where Sunderland’s outside hare starts to show its hand. On tracks with an inside hare, Trap 5 is often a graveyard — squeezed by two wider draws but without the rail protection of the inner traps. At Sunderland, the Outside McGee system gives dogs in Trap 5 a slightly more natural early path towards the hare, bumping its win rate closer to 16–17% on aggregate. It is not an advantage in the conventional sense, but it removes some of the disadvantage.
Trap 6 is the wildcard. Nationally, the widest draw tends to win about 15–16% of races unless the track configuration specifically favours it. At Sunderland, Trap 6 numbers broadly align with that range, but they mask considerable distance-by-distance variation. Over the 261-metre sprint, Trap 6 is at its weakest: the race is too short for a wide runner to recover any lost ground if it does not lead off the first bend. Over the 828-metre stayer trip, Trap 6 improves noticeably, because there are four bends — and therefore four opportunities — for a galloper to find space on the outside.
One thing the raw numbers do not capture is pace. Sunderland tends to card competitive fields, particularly on BAGS afternoons, and the dogs drawn middle often get bumped more frequently than they would in a lower-grade race at a quieter venue. If you are handicapping a specific race rather than looking at population trends, the presence of known early-pace dogs in the traps adjacent to your selection matters more than the macro win percentage. The stats give you a baseline; the racecard gives you the edge cases.
Trap Performance Across Sunderland’s Four Distances
Treating trap stats at Sunderland as a single data set is a bit like averaging the temperature across all four seasons and calling it “mild.” The numbers only become genuinely useful when you separate them by race distance — and at Sunderland, the four distances on the programme create four meaningfully different trap profiles.
261 Metres — The Sprint
The 261-metre dash is Sunderland’s shortest trip, and it is the distance where trap draw matters the most. The race involves a short straight followed by a single bend before the finish line. There is almost no time for a poorly drawn dog to recover from early crowding. Trap 1 and Trap 2 dominate sprint stats at most UK tracks, and Sunderland is no exception: the inside draws benefit from an uninterrupted early path and carry that momentum through the solitary turn. Trap 6 on the 261 is the draw most bettors instinctively downgrade, and rightly so. Unless a dog from the widest box has a decisive early-pace advantage over everything drawn inside it, the geometry of the sprint simply does not allow enough racing distance to compensate for a wide first bend.
For punters, the practical takeaway is blunt: in 261-metre races at Sunderland, treat Trap 1 as a genuine edge and Trap 6 as a red flag unless the form strongly argues otherwise. This is the one distance where the trap draw can override moderate form advantages.
450 Metres — The Standard Trip
The 450-metre race is Sunderland’s bread-and-butter distance. Most graded races are run over it, most form data relates to it, and most punters will encounter it on every single racecard. The 93-metre run-up to the first bend gives the field a longer straight to sort into racing order before the first turn compresses things, which means the raw inside bias from the 261 softens here.
Trap 1 still leads the 450-metre stats at Sunderland, but the margin over Traps 2 and 3 narrows to roughly a percentage point or two. The extra run-up distance allows middle-draw dogs to establish position, and the two full laps of the circuit — four bends — provide enough racing for a strong-finishing dog from Trap 5 or 6 to pick up the pieces if the leaders tire or collide. The 450 is essentially the distance where trap bias and form are in approximate equilibrium: you should note the draw, but a dog’s recent times, pace style and grade are carrying equal or greater weight.
One nuance specific to Sunderland at 450 metres is the interaction between the Outside McGee hare and the first bend. Early-pace dogs from Traps 4 and 5 can sometimes cut across towards the hare and secure a lead position before the turn, a move that would be harder on an inside-hare track where the inner traps have a more direct line to the lure. If the racecard shows a known front-runner drawn in Trap 4 or 5 against a field of middling pace, that dog may have a better chance than the aggregate trap stats suggest.
640 Metres — The Middle Distance
Sunderland’s 640-metre trip is where the major open races happen. The ARC Grand Prix, one of two Category One competitions staged at the stadium, is run over this distance — and it was here that New Destiny posted a track-record 38.79 seconds in April 2025. The 640 uses an 84-metre run-up, which is a touch shorter than the 450’s 93 metres, so you might expect the inside bias to strengthen. In practice, the effect is offset by the sheer length of the race: six bends over three-quarters of a lap more than the 450 means there is substantially more time for positions to change.
Trap data on the 640 at Sunderland shows a flatter distribution than either the 261 or the 450. Trap 1 still edges things, but the gap between best and worst traps compresses. Dogs from the outside draws have a greater opportunity to use their stamina, and the additional bends create natural overtaking points — particularly on the back straight, where a dog with a powerful late pace can sweep wide and pass tiring leaders. If you are analysing a 640-metre race at Sunderland, the trap draw is a factor, but running style (early pace versus late pace) and recent stamina form probably carry more predictive weight.
828 Metres — The Staying Trip
Very few UK tracks card 828-metre races, and at Sunderland these events appear less frequently than the other three distances. The staying trip is effectively two full laps of the circuit — eight bends — and the sheer volume of racing eliminates most of the positional advantages that exist at shorter distances. A dog drawn in Trap 6 that finds itself wide on the first bend has seven more bends to recover. A dog from Trap 1 that leads early may not have the stamina to hold on over twice the standard distance.
The 828-metre trap stats at Sunderland tend to show something close to a level playing field across all six boxes. If anything, the outside traps perform slightly better relative to their overall average, because the wider dogs can settle into a rhythm without getting hemmed in on the rail. For a bettor, the message is clear: at 828 metres, forget the trap draw almost entirely and focus on stamina, recent finishing positions, and whether the dog has proven form over the distance. Trap bias is a tool, not a religion, and the staying trip is where it loses most of its predictive power.
How Sunderland Compares to Other UK Tracks
Trap statistics only become truly useful when you have a benchmark. A bettor who follows Sunderland exclusively might assume the stadium’s trap profile is normal — but normal varies dramatically across the 18 GBGB-licensed tracks still operating in England and Wales. Let us put Sunderland in context.
At the inside-bias end of the spectrum sits Towcester. Data from OLBG shows that Trap 1 at Towcester wins around 20% of races — a full three-plus percentage points above the theoretical 16.6% baseline and comfortably the highest Trap 1 rate of any major UK venue. Towcester’s track geometry, combined with an inside hare and relatively tight bends, funnels the field towards the rail early, giving the inside draw a pronounced structural advantage. If you have been betting primarily at Towcester and then switch to Sunderland, you will need to recalibrate: Sunderland’s Trap 1 wins at a lower rate, and the Outside McGee hare means wide draws carry less of a penalty.
At the opposite extreme is Harlow, where Trap 6 posts a remarkable 21% win rate — the highest wide-draw figure in the country. Harlow’s configuration, with a long run-up and an outside hare, creates conditions where the widest draw can actually be the best draw in certain race types. Sunderland does not go that far: its Trap 6 figures are not dramatically elevated, partly because the stadium’s bends are tighter than Harlow’s and partly because the run-up distances, while decent, do not give the wide draw as much room to manoeuvre into a leading position before the first turn.
The national average for favourite win rate — 35.67% across all graded races in 2024 — provides another useful reference point. That figure tells you how often the market gets it right, and it interacts with trap data in a practical way. If a favourite is drawn in a statistically unfavourable trap, the market’s implied probability may be too high. If a second or third favourite lands in a strong trap, the value might lie there instead. Sunderland’s trap profile, sitting roughly in the middle of the UK range, means these adjustments are modest — you are not making the dramatic corrections you would at Towcester or Harlow, but you are still making adjustments that compound over dozens of bets.
A handful of other tracks deserve a quick mention for comparison. Romford, another tight inside-hare circuit in east London, shows a strong inside bias similar to Towcester. Nottingham, with a wider track and an outside hare, shares more of Sunderland’s flatter trap distribution. Sheffield, one of the busiest BAGS venues, tends to produce a moderately flat profile across the middle traps but with Trap 1 slightly elevated, similar to what we see in Sunderland’s aggregate data. The takeaway for anyone following greyhound racing at multiple venues: each track has its own fingerprint, and borrowing conclusions from one to another without checking the data is a fast route to bad selections.
Where Sunderland stands out is not in any single dramatic trap bias but in the consistency of its trap data across a high volume of fixtures. A year-round schedule of regular meetings means the sample sizes are large enough to trust. Some smaller venues produce eye-catching trap figures that are actually just statistical noise from a thin fixture calendar. Sunderland’s data has the weight of repetition behind it, which makes the patterns — even the subtle ones — more reliable as an input to your analysis.
Using Trap Stats to Sharpen Selections
Data without a framework is just a spreadsheet. So how do you actually apply Sunderland’s trap stats to a Friday night racecard without turning every selection into a maths exercise?
Start with the distance filter. As we have established, trap draw is most decisive over 261 metres and least decisive over 828. When you sit down with a Sunderland racecard, mentally sort each race into one of two categories: “trap-sensitive” (261, and to a lesser extent 450) or “form-dominant” (640, 828). In the trap-sensitive category, treat the draw as an active factor in your selection process. In the form-dominant category, note the draw but give it less weight than recent finishing positions and pace style.
Next, layer in the hare-type context. Because Sunderland runs an outside hare, do not automatically assume the inside draw is the golden ticket. Look at the early-pace ratings in the racecard. If the field contains a known front-runner drawn in Trap 5 that has a clear early-speed edge over the adjacent Trap 4 and Trap 6 dogs, that dog has a legitimate route to the first bend in a way it might not at a venue like Towcester. The hare angle matters most when two or three dogs in a race have similar pace ratings — in those situations, the trap drawn closer to the hare rail gets the marginal benefit.
The third step is the comparative check. If you follow racing at multiple tracks, remember that Sunderland’s trap biases are moderate. A Trap 1 draw at Sunderland is worth a small nudge in your ratings; a Trap 1 draw at Towcester is worth a bigger nudge. Adjust your expectations accordingly, and do not apply a Towcester-calibrated trap filter to Sunderland data.
Now a word on what trap stats cannot do. They cannot tell you whether a specific greyhound will break cleanly from the boxes. They cannot account for a dog that has been regraded since its last run or one that is returning from injury. They cannot predict first-bend trouble, which is the single biggest source of randomness in any greyhound race. As BGRF Chairman Joe Scanlon has noted, the sheer volume of races staged across the UK — with two content suppliers vying for bookmaker customers and the resulting pressure on greyhound numbers — means that field composition can vary dramatically from one fixture to the next. On a strong Friday night card at Sunderland, you may get competitive six-dog fields where trap draw matters more because the margins are tight. On a weaker midweek BAGS card, open-grade runners might be so varied in ability that the best dog wins from any trap.
The pragmatic approach is to think of trap stats as one layer in a multi-layer model. Form is the foundation. Pace and running style sit above it. Track conditions — the going report, the time of year, whether the meeting is day or night — add another layer. And trap draw sits on top, as a tiebreaker. In races where two or three dogs are closely matched on form, the trap draw can swing your selection. In races where one dog is clearly the best on merit, the trap draw is largely irrelevant — a class act from Trap 6 will still beat moderate opposition from Trap 1 far more often than not.
One final thought for anyone who plans to track trap stats over time at Sunderland: consistency matters more than any single night’s results. A small sample from a single meeting can easily show Trap 6 winning three races out of twelve — but that means nothing in isolation. Build your data over weeks and months, and you will see the structural patterns emerge from the noise. The track’s five-meeting weekly schedule means you can accumulate a useful sample within a couple of months, which is a luxury that bettors at less busy venues do not enjoy.
Responsible gambling reminder: Trap statistics are an analytical tool, not a betting system. No statistical edge, however well documented, guarantees returns over any given period. Set a budget, stick to it, and treat greyhound racing as entertainment first. If you feel your betting is becoming a problem, visit BeGambleAware.org or call the National Gambling Helpline on 0808 8020 133.